E-Commerce Sales Analytics — SQL Project

Concept / Problem
When people think of e-commerce, they think of shopping carts and checkout buttons. I see data. Every click, every payment, every product added to a basket is a story waiting to be told — if you can structure and query it the right way.
For this project, I built a mini data warehouse in PostgreSQL to simulate e-commerce sales. My goal: demonstrate advanced SQL skills that go far beyond SELECT * FROM.
Why E-Commerce?
E-commerce is the perfect playground for analytics. It touches on everything:
- Customers → repeat buyers, churn, loyalty.
- Products → best sellers, inventory analysis, revenue share.
- Payments & Stores → multi-channel performance.
- Time → seasonal trends, growth, and forecasting.
If you can query this, you can query almost anything.
What I Built
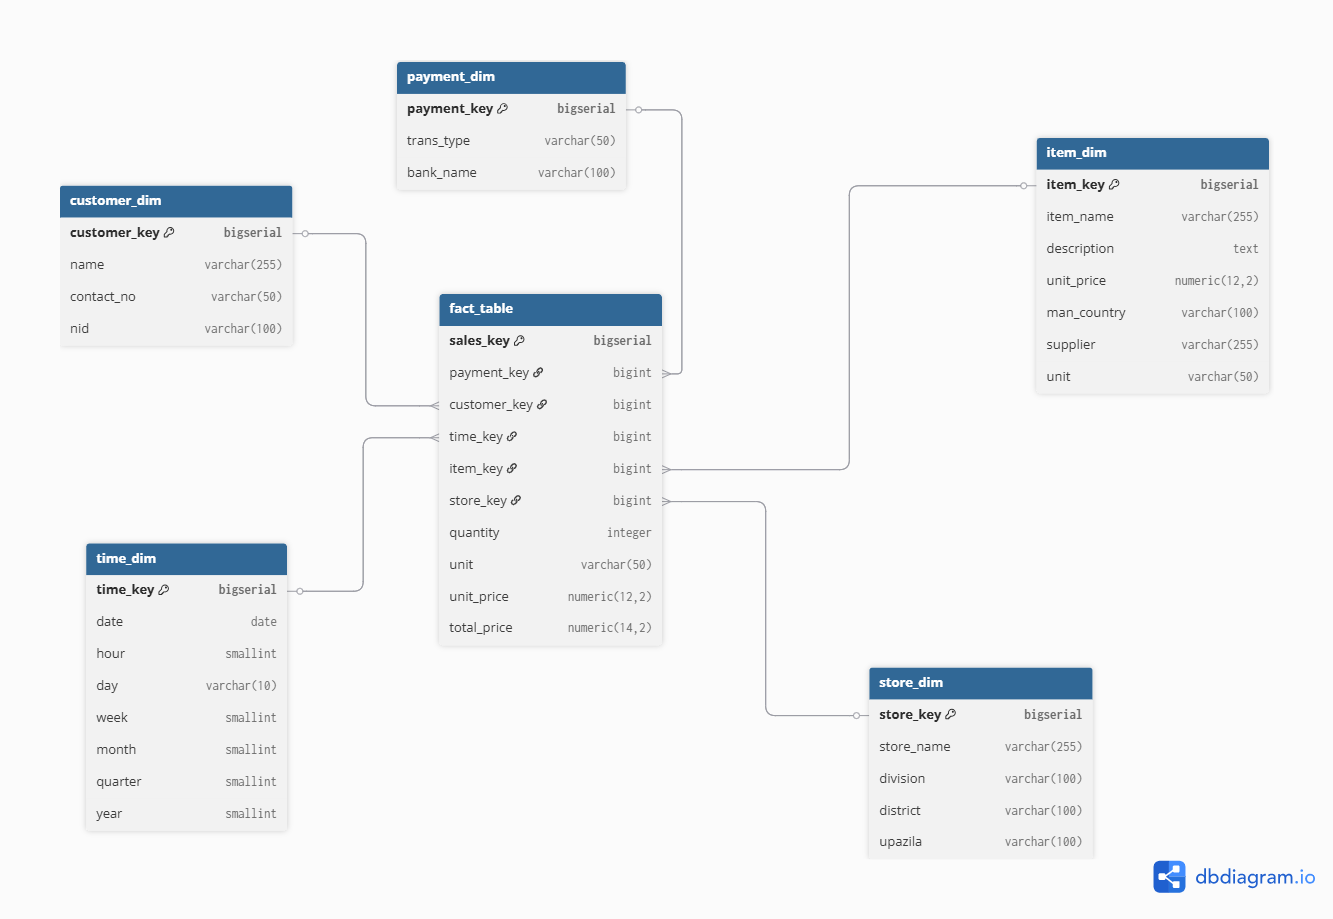
Customers who left within the last month- Designed a star schema with one fact table (fact_sales) at the center and five dimension tables (dim_customer, dim_item, dim_store, dim_payment, dim_time).
- Wrote SQL scripts for schema creation, indexes, materialized views, and data validation.
- Developed analytical queries that show revenue trends, top sellers, repeat customer behavior, and store performance.
- Automated reports with stored procedures.
Key SQL Highlights
- Window Functions: ranking top 5 products per month, running totals per customer.
- CTEs: simplifying multi-step logic like repeat customer rates and cohort analysis.
- Data Validation: ensuring referential integrity, checking orphaned keys, and validating calculations.
- Optimization adding indexes and using materialized views for faster reporting.
Even with synthetic data, you can uncover patterns:
These are the exact kinds of insights business leaders expect from an analyst.
Business Insights from the Data
- Seasonality: Analyzing total revenue by quarter shows consistent peaks in Q3 and Q4, indicating seasonal spikes likely driven by holidays and promotions. Businesses can leverage this insight for inventory planning, targeted marketing, and staff allocation.
- Pareto Principle: The top-selling products (e.g., Red Bull 12oz, K Cups variants) account for roughly the first ~20% of products but drive over 75% of revenue. This highlights a classic Pareto distribution, suggesting focus on high-performing SKUs for marketing and inventory strategies.
- Customer Loyalty: Analysis of repeat purchases shows that 100% of customers in the dataset have made multiple purchases. This indicates extremely high customer retention in the sample data, which could be used to model loyalty programs, retention campaigns, and personalized marketing. (Note: because synthetic data is used, this is expected — in real-world data, this would likely be lower.)
Takeaway
- This project was about proving one thing: SQL isn’t just about pulling data. It’s about shaping it, validating it, and telling a story with it.
- With this foundation, it’s easy to imagine plugging the same database into Power BI, Tableau, or a Python notebook and turning raw queries into dashboards and forecasts.